Buddhabrot Generator
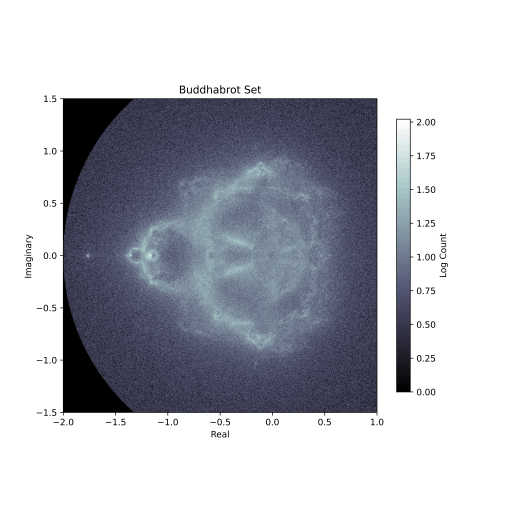
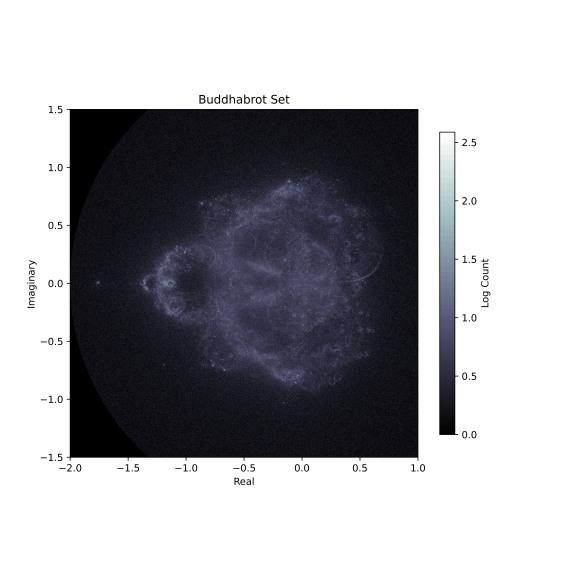
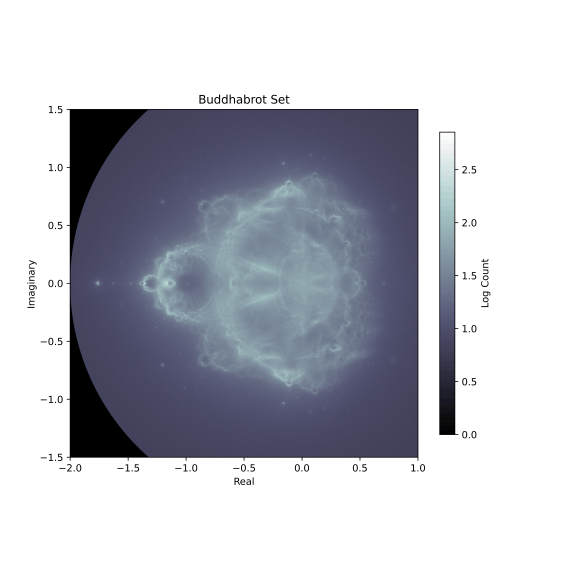
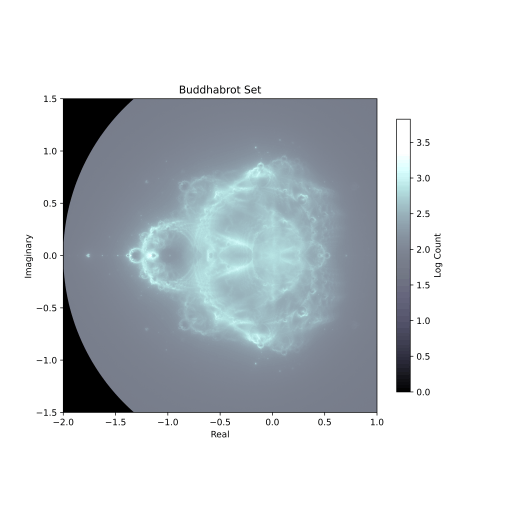
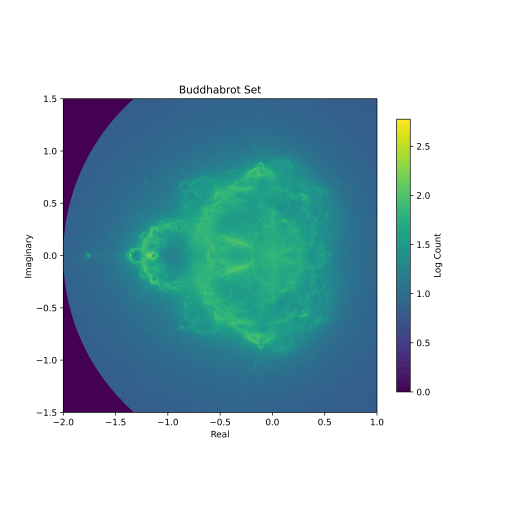
Buddhabrot Set: The Buddhabrot set is a visualization technique that is derived from the Mandelbrot set. It involves tracing the orbits of complex numbers within the Mandelbrot set to determine if they escape or remain bounded. The Buddhabrot set visualizes the density of the escaped points and highlights regions that are more likely to lead to escape. It is named after its resemblance to a silhouette of the Buddha.
Uses the Matplotlib and NumPy libraries.
Click here for full colormap list.